
A New Way to Slice and Dice

It's often useful to reference a rolled-up measure outside the context of the View that calculates it — in other words, as a new data dimension. Rebuilding that new dimension in real time when its source View is filtered creates a new way to slice and dice.
For example, let's say you create a pivot table or data view that contains a complex, summary analysis. Suppose you now want to use the result of that analysis to further segment the original dataset. Ordinarily you've no choice but to manually connect this summary analysis back to your source data. And then sigh when you're asked to segment the new analysis across time or geography, because you have to repeat the whole procedure again.
Segmentation power is the key to productive data analysis. Spendata already offers multi-pass segmentation, in the form of dynamic mapping and derivation, a unique capability for solving problems out of the reach of ordinary tools. Now we've added more power: the ability to instantly convert a View-level measure into a Fact-level dimension. You can choose any measure: an ordinary rolled-up measure, a complex measure such as countUnique(), or a computed measure of your own creation.
That's akin to converting the output of an Excel pivot table into a new column in your data, and then using that new column (along with the original columns) as the basis for more pivot tables. Unlike the handstands you'd need to make that work in Excel, it's just a couple of clicks in Spendata.
The best part is that the derivation of the new dimension is dynamic. Every time you filter its source View, the new dimension changes in real time to match the filter, and any dimension or View dependent on the new dimension updates as well. That's also true if you re-derive a column underlying the source View, or if you add data, or if a mapping rule changes the source View.
Let's say we wanted to compare cost/FTE by commodity across business units. Simple — just convert cost/FTE by commodity to a dimension, then use the dimensional value to compute deltas by business unit. Two more clicks for a bar chart, and done. A similar strategy works for benchmarking as well as for KPIs. Such an analysis can be refined in seconds. For example, we could exclude certain vendors, or include only the last two quarters — just filter the source View accordingly. Everything updates immediately and automatically, including the bar chart.
The figure below illustrates the promotion of a dimensional measure into a Fact column. Every transaction is stamped with the associated dimensional value.
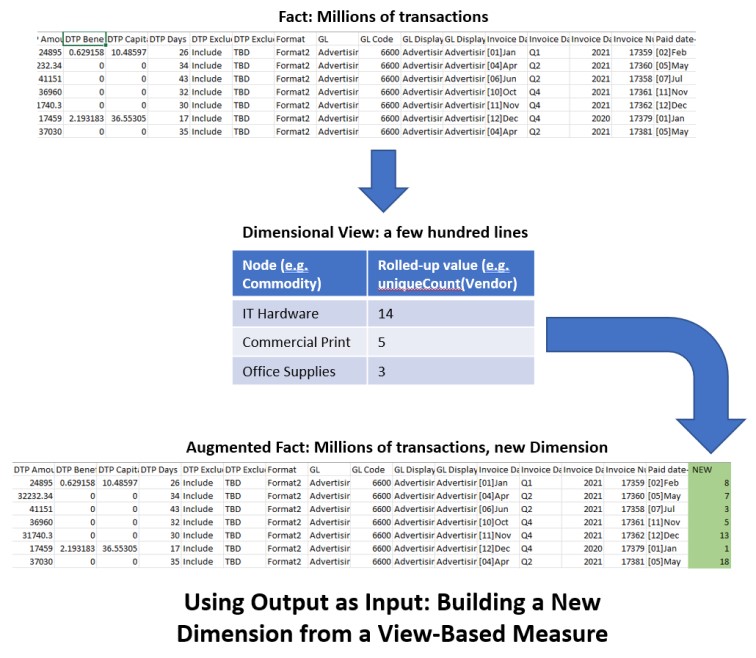
The derived dimensional value is useful everywhere that Commodity has meaning, whether as the value itself ([new dim value]/[count]), as a derived range, or as part of a computed dependent dimension of arbitrary complexity.