Dynamic Mapping and Derivation: The Next Step in Spend Analysis

In a previous post, we discussed the key difference between business intelligence and spend analysis tools: the power of mapping. In this post, we explore how dynamic mapping and derivation merges the immediacy of a modeling tool with the insight-producing power of a pure analytics system.
Dynamic Mapping
Mapping is the creation of new columns in a dataset that provide fresh insights into the data. The data in mapped columns is either inferred from information elsewhere in the dataset, or it is known to and entered by the user. Most spend analysis systems perform mapping offline. That process generates a static dataset which is then loaded into a BI-type front end.
Mapping rules are remembered and replayed whenever data is added. This allows the mapped columns to stay relevant as new data are added over time. New mapping rules can be created offline as well, to refine and improve the output.
However, if the mapping procedure changes from an offline task to an online, dynamic process, there are immediate benefits. Changes are immediately reflected in the database in real time. Whether adding data or improving/adding mapping rules, those changes become analogous to an Excel “recalc”. In other words, when something changes in the model, the model immediately adapts to the change.
Dynamic mapping is far more useful to an end user than having to wait for the results of an offline process that might occur only once a month or quarter. If mapping can be changed in real time, then errors in the mapping, which are inevitable, can be easily and instantly corrected.
Now, what if this type of dynamism can be extended to the entire database?
Dynamic Mapping and Derivation
In a modeling system (like a spreadsheet), changing one item can create a cascade of changes. The dependencies between data tables and cells are maintained automatically by the tool. That's why we use spreadsheets, and that's the source of their power.
A database or BI system, on the other hand, is static, not dynamic. It can't and won't change until it's rebuilt offline. End users typically have no control over the rebuild process.
But what if the database were as flexible as the spreadsheet? What if any column in the dataset, not just mapped columns, could be re-derived dynamically, in real time? In other words, suppose that a database system allowed and maintained the same dependencies between objects as a spreadsheet does — so that a "recalc" equivalent is performed whenever anything changes. This is how we've designed Spendata.
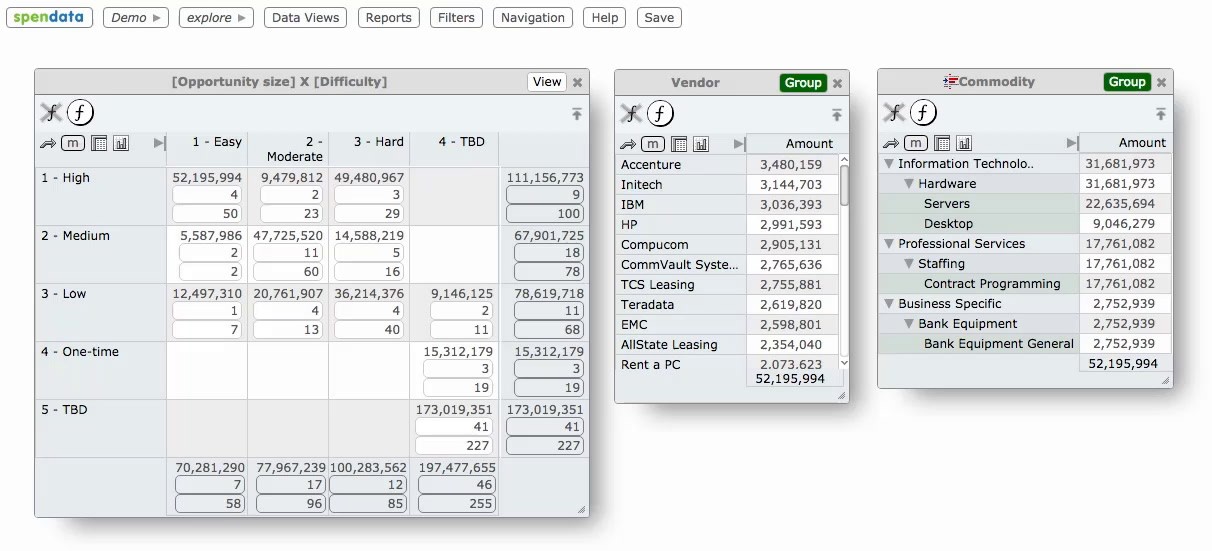
For example, let's say we create a "Sourcing Opportunity" column that's mapped based on Commodity and Vendor Parent. We then map this new Sourcing Opportunity to "Difficulty (easy, moderate, hard)" as well as to "Opportunity Size (high, medium low)". A crosstab of Difficulty X Opportunity Size creates the beginnings of a sourcing plan:
This simple example creates multiple complex dependencies. For instance, if we alter a Commodity mapping, then Sourcing Opportunity changes, and the values in the above table change. If we family a Vendor, this changes Vendor Parent, which in turn changes Commodity, both of which impact Sourcing Opportunity, as well as the values in the table.
When all of these cascading changes can occur in real time, we've turned a spend analysis system with powerful mapping and visualization capability into a dynamic modeling tool as well.
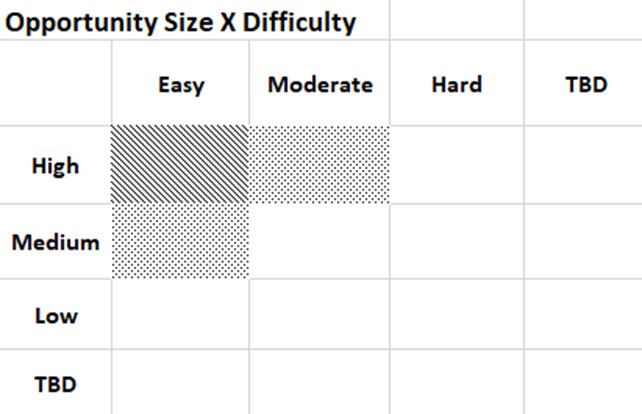
Here's a snippet from Spendata's tutorial help system illustrating what happens when a Vendor is mapped to a new Difficulty level.