

We're pleased to note that Spendata has been designated one of the 2025-2026 "50 Providers To Know" by Spend Matters analysts, who are now part of The Hacket Group's Solution Intelligence team. This list represents "the best-in-class solutions that the industry needs to know about."
Read More
Being curious — and asking embarrassing questions — is exactly the right thing to be doing.
Read More
We didn’t start out to build a multipurpose business data analysis tool, but by focusing on the data analysis issues confronted by our users, we ended up solving hard problems that aren't handled by specialized software providers.
Read More
Spend Analysis systems should empower users to perform classification-based analysis, not force them to download data to third-party applications.
Read More

We're pleased to note that Spendata has been designated one of the 2024 "50 Providers To Know" by Spend Matters, which recognizes "the best-in-class companies in the procurement and supply chain market."
Read More
The rubber has met the road. Spendata provides real-time genAI mapping capability that you can use — today — on your own.
Read More
The key to managing genAI mapping rules — results of uncertain correctness — is provenance. Where did the rule originate? Who has reviewed it for accuracy? What action does the AI propose, before we just go ahead and implement it?
Read More
We're pleased to note that Spendata has been designated one of the 2023 "50 Providers To Know" by Spend Matters, which recognizes "the best-in-class companies in the procurement and supply chain market."
Read More
Finding out what data means has always involved dumping subsets of it to a database or spreadsheet. Not anymore. Inside Spendata, we can quickly build models at database scale that automatically reconfigure and recalculate themselves as we alter filters, mappings, and data.
Read More
We are often asked about AI and its applicability to spend analysis and Spendata. Here's our take.
Read More

Data analysts must routinely provide answers to questions that are unanswerable unless the data can be re-organized, re-categorized, and re-processed – all of which are impossible to accomplish inside a read-only database like a BI tool. Those things are possible in a spreadsheet, but only at small scale and with no controls or auditability. Spendata fills this analysis gap.
Read More
I enjoy playing with generative AI (ChatGPT, Stable Diffusion, etc.) as much as anyone, but the shock and awe coming from ordinarily sober commentators needs to be tempered a bit.
Read More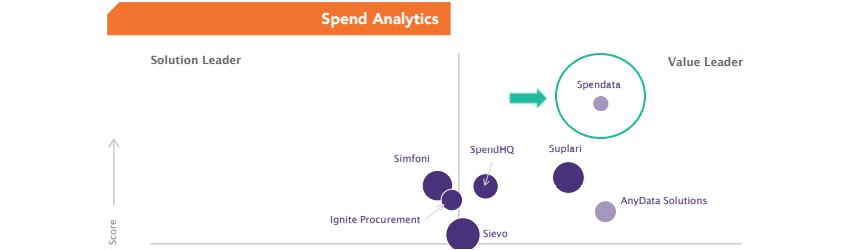
Spendata scores high when measured head-to-head with competitive spend analysis solutions.
Read More
Spendata has been designated one of the 2022 "50 Providers To Watch" by Spend Matters, which recognizes "fast-rising companies in the procurement and supply chain market."
Read More
Extending the power of mapping — from a static process with limited scope, to a dynamic process with unlimited scope — enables spreadsheet-like modeling at database scale.
Read More
If you’re interested in augmenting your product or deliverable with world-class analytics, consider the advantages of partnering with Spendata.
Read More
BI dashboards are a reasonable way to present spend analysis results. But a set of BI dashboards isn’t a spend analysis tool – it’s an outsourced services deliverable.
Read More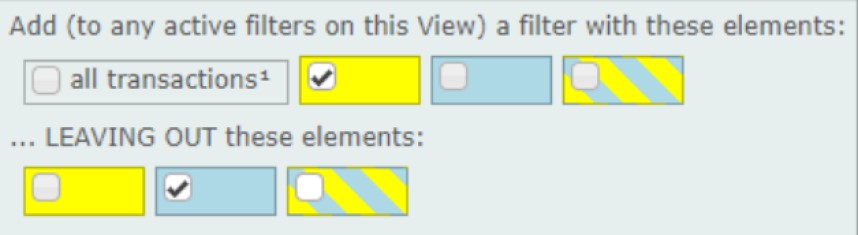
User interface improvements for BI and similar tools are long overdue. Spendata was designed from scratch, without any reliance on existing tools. That enabled us to rethink those ideas from first principles.
Read More
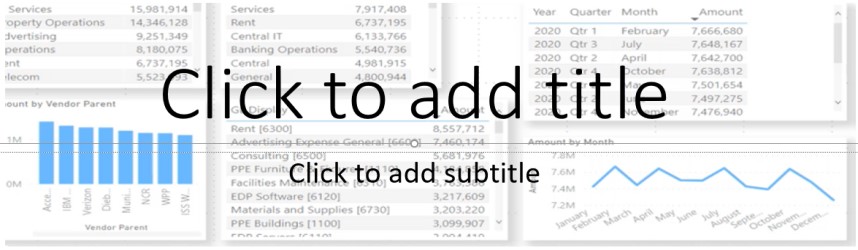
The state of the art for procurement data analytics is to deliver pre-cooked data inside a BI tool like Tableau, Power BI, or Qlik. Visualization tools are helpful, but they aren’t good enough.
Read More
It's often useful to reference a rolled-up measure outside the context of the View that calculates it — in other words, as a new dimension. Rebuilding that new dimension in real time when its source View is filtered creates "a new way to slice and dice."
Read More
At Spendata, we think conventional ETL thinking is flawed. At data load time, you have neither the scope nor the information required to make any decision that isn’t essentially trivial.
Read More
A reliable estimate of zero-disruption Procurement cost synergies can be performed quickly and easily as part of the pre-merger “clean room” exercise. Using Spendata, the only data necessary are last year’s spend by vendor and a list of contracts.
Read More
When spend analysts can automatically inherit changes from a central cube without losing their custom work, all kinds of applications become possible.
Read More
Fostering independence should the goal of spend analysis services, because of its obvious benefit to customers.
Read More
It’s time to consign the idea of a one-size-fits-all spend cube to the dustbin of history.
Read More
It’s rare when your data cooperates by always being in the same format, and variations in format or entirely new formats can cause major headaches. Not with Spendata.
Read More
Organizations may be unwilling to pressure vendors on price in the middle of a global supply chain crisis. However, there are plenty of ways for data-driven businesses to initiate savings efforts without going to market.
Read More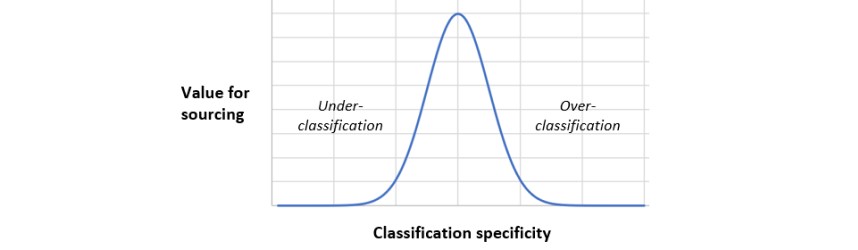
It’s tempting to think that more classification is better, but over-classification can derail a sourcing effort before it starts.
Read More
Here is a brief introduction to Spendata. It also serves as a guided tour to Spendata collateral via the embedded links, should the reader desire additional information on a particular point.
A printable PDF link to the executive summary is available at the end of the introduction, for offline use.

Spendata cubes can now be exported to Power BI in star schema format. Star schemas dramatically reduce file size and allow Power BI to operate at maximum efficiency.
Read More
Spreadsheet models gain their power and popularity from dependencies – that is, the idea that a change in one area of a model will propagate through the rest of the model. Spendata allows databases to behave this way as well.
Read More
Matching contract data to actual spending generates very useful information, but the matching process can be difficult. Spendata's auto-familying function makes this quick and easy.
Read More
Some claims from spend analysis vendors remind us of an old Steve Martin gag.
Read More
A useful data analysis system must not only adapt itself to input data, but also adapt itself to changes in the input data over time.
Read More
When your data stays on your own machine and is never transmitted to a server, data sovereignty issues evaporate.
Read More
Dynamic mapping and derivation merges the agility of a modeling tool with the insight-producing power of a spend analysis system.
Read More
Both spend analysis and general-purpose BI tools derive their power from the ability to query large datasets quickly and efficiently. BI tools applied to spend data can tell us the vendor, the amount, the buyer, and how the spend was booked. But spend analysis systems, from the same data, can use mapping tools to deduce 'what' was bought, which is the key to launching successful sourcing and spend management initiatives.
Read More
Deloitte's 2021 Global CPO Survey, titled "Agility: The antidote to complexity", spotlights agility as key for high performing procurement organizations. At Spendata we're delighted with this conclusion, because we've built our product around that very principle.
Read More
It is customary for companies to require in-depth security reviews for web-based software vendors, because sensitive customer datasets end up on cloud servers that are exposed to attack and breach. But what if your data never leaves your machine?
Read More
Buried in many consulting groups is an analyst who has mastered the art of building spend cubes with spreadsheets, and has therefore become indispensable. It’s a waste of talent!
Read More
Sometimes it's hard to decide whether spend analysis is a product or a service, especially when data preparation is opaque to users.
Read More
Plugging in just a few numbers that you already know (or can make a reasonable guess at) can generate a pretty good estimate of your short-term spend analysis savings potential.
Read More
It doesn't matter who built your spend cube or how it was built. You can leverage Spendata's powerful mapping facilities and unsurpassed analysis capability without losing any of the work you've put into your old system.
Read More
Your company likely has many different systems involved in procurement, each with their respective silos of data. A data inventory map soon becomes a critical resource in any spend management effort.
Read More
Here's a 3 minute video from a European distribution partner explaining Spendata's unique inheritance feature. Inheritance allows analysts complete freedom to modify spend cubes because their changes are preserved across refreshes.
Read More
There's a key difference between Spendata's auto-mapping and the "opaque" auto-mapping provided by, for example, neural-net based AI's. Those solutions provide the mapping as a fait accompli. You can't review what they've done, or understand why they've done it.
Read More
The 20th-century art movement revolutionized traditional painting. Instead of limiting the representation of an object to two dimensions, it showed the viewer all the possible viewpoints of an object at once. Okay, so it may not be a perfect comparison, but Spendata’s “cubism” brings a similar perspective to the field of spend analysis.
Read More
Though ‘agile’ principles originated with software developers, the central idea has universal value: move from idea to impact as quickly as possible. Unfortunately, that’s easier said than done without supporting processes and systems.
Read More
Data analysis can take a long time with the wrong tools. That's why it's perfectly reasonable to avoid low-probability analysis, since the expected value of the effort outweighs the expense. But when proper tools are in place and the cost assumptions change, it makes perfect sense to go looking for value!
Read More
It’s the 95% perspiration necessary for the 5% insight. With spend analysis, there are two ways to do the sweaty part of the job: (a) get a spend analysis tool that can easily map and segment your data, or (b) spend your nights and weekends hacking on spreadsheets.
Read More
“Segmentation” refers to the way in which data can be organized into buckets in order to gain insight. "Qualitative segmentation" is segmentation that is not trivially supported by the data.
Read More

Here's a one-and-a-half minute video on Spendata's unique inheritance feature. Inheritance allows the entire enterprise to modify and adapt spend cubes for their own purposes, while preserving their changes across refreshes.
Read More
The segmentation performed by all spend analysis systems is the grouping of like vendors together ("Familying") and the assignment of spending to Commodity ("Mapping"). This is a continuous process as new data is added. If that process is opaque to you, a dependence on the spend analysis vendor is created that is both expensive and difficult to sever.
Read More
BI tools are terrific at some things, but they're pretty awful at creating dynamic data structures like a Preferred Vendor dimension.
Read More
It's easy to lose a lot of sleep setting up and maintaining a Preferred Vendor column with Excel.
Read More
Spend analysis vendors don't want to talk about it, but automatic mapping always requires manual corrections and enhancements. There are lots of reasons why, but the simplest reason is that the way you use a vendor is not necessarily the way that another company uses them.
Read More