
Why Data Analysis is Avoided

Clever people make smart choices every day. One of those choices is the decision not to perform low-probability ad hoc data analysis. Sometimes this decision is based on hard-won experience, and sometimes it’s a gut feel; but it has a strong rational basis.
Consider a low-probability $50K savings opportunity that you suspect might be hiding in your data. Suppose your analyst cost is $700 per day. That means every day spent chasing the opportunity is not only $700 lost, but also $700 that could have been productively spent elsewhere — a net loss to the business of $1400.
In the diagram below, we’ve plotted the expected value of such an analysis (i.e., probability x reward) as a function of days to analyze and chance of success.
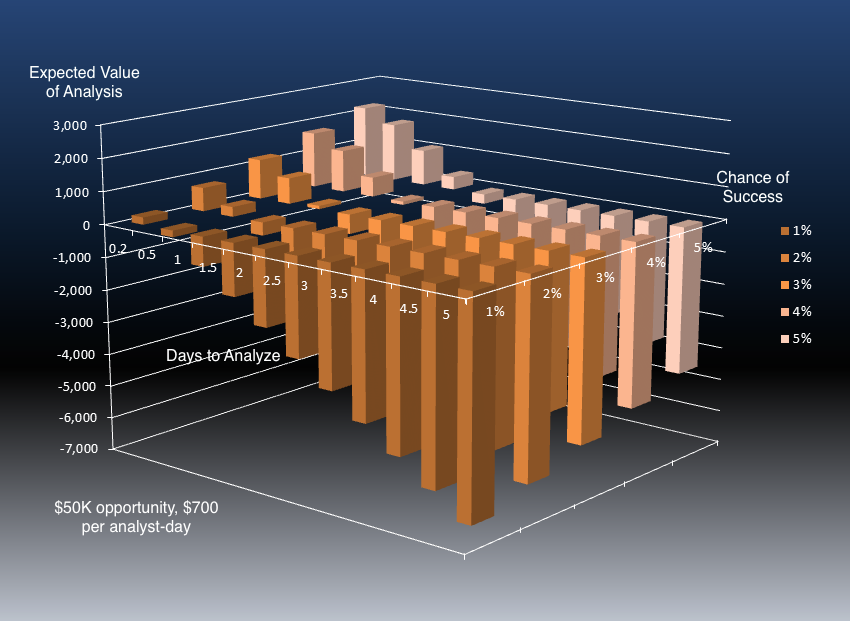
Notice that the graph is mostly “underwater”; that is, the expected value of the ad hoc analysis is negative. That’s the mathematics behind the “gut feel.” When the expected value is negative, it makes no sense to pursue the strategy (which is why buying lottery tickets is a poor financial plan).
Unless the probability of success is quite high, or the time taken to perform an analysis is quite low, it’s just not a good idea to undertake it. An analyst can only work for 220 days per year, and sending him or her off on a wild goose chase is a risky decision. Therefore, we don’t do it, and our hunches remain hunches forever.
But what if it wasn’t risky at all?
Nothing can be done about the probability that an analysis will be fruitful — it is what it is. But plenty can be done about “Days to Analyze.” Suppose a dataset could be built in 5 minutes, and analyzed in under an hour? As you can see from the graph, this turns the expected value of speculative analysis sharply positive. Suddenly it is a very good idea to perform ad hoc analysis.
With Spendata, you can perform productive analysis quickly, which opens up new opportunities to analyze spending patterns and uncover more opportunity. And that’s good news, because there is a ton of useful data floating around the average company that nobody ever looks at. Top of the list? Invoice-level detail, from which all kinds of interesting conclusions can be drawn.
Try this experiment: acquire invoice-level (PxQ) data from a supplier with whom you have a contract. Dump it into Spendata, and chart price point by SKU over time. Chances are, like most companies, you’ll find something very wrong, such as prices all over the map for the same SKU (ironically, sometimes this happens even if you have an e-procurement system that’s supposed to prevent it). If you have a contract, only one of those prices is correct. The rest are obviously not, and represent money that you can easily recover from the vendor.
Bottom line: if you can build a dataset by yourself — in minutes — you’ll end up above water, just like the graph.