
Re-Thinking the User Interface
User productivity improvements cannot occur without a reevaluation of user interface ideas that have become de facto standards in BI tools and elsewhere. Spendata was designed from scratch, without any reliance on existing tools. That enabled us to rethink those ideas from first principles. Here are two examples.
Filtering
Everyone by now is familiar with filtering in a BI tool. The basic idea is to click on an item in a View, which causes all the Views on the dashboard to filter by that item. Each filtering operation refines the previous one to create “the current filter”, which is a global filter on the entire dashboard.
This idea works well – for the first few minutes. But you very quickly run into situations where you don’t want all of the Views to filter together. You’re usually interested in having only a handful of them filtering together, or perhaps none of them at all.
Problem is, allowing Views to be filtered uniquely means that there is no longer a global filter. Now there are many active filters, because each of the Views must maintain its own filter state and its own history of filters. How does the user manage all these filters? How does the user apply one View’s filter to another? Naming filters in order to share them doesn’t scale to this scenario.
Spendata changes the game – and solves this whole issue – by giving filters on-screen reality. Spendata filters are physical objects – filter coins – that you can drag and drop to cause actions. Dropping a filter coin on a View causes that View to filter. The current filter on a View is also a filter coin, so a copy of it can be dragged and dropped somewhere else.
Where appropriate, every Spendata operation provides a filter coin that you can drag/drop. Filter coins can be “dragged out of” any item of any View or chart (just click on the item and drag – the coin appears under the cursor). Searching produces a filter coin with the search contents. Filter histories provide filter coins. Mapping is performed by dragging filter coins. Filter coins can be saved on the viewport and/or named for global access.
When users begin to think of a filter not as an abstract representation of the current state of a dashboard, but rather as a physical representation of the transactions it identifies, it’s much easier to think about what’s going on. Instead of being an abstract idea, the filter becomes a real object with real contents.
Marking
Marking is where filter coins demonstrate their true potential. How do you identify a set of items using filtering, then designate that set independent of the filter that found it? Having designated a set of items, how do you specify its intersection with another set of items, or its difference? Those things are possible with OLAP-extended SQL, but business users are not DBAs nor are they interested in learning SQL.
Marking and filtering allows business users to address these things easily.
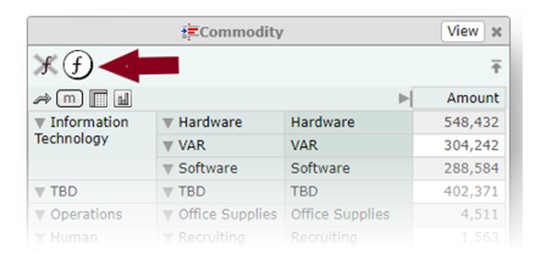
With Spendata, you can mark an item or items with colors – for example, dropping a filter coin on the banner of a View to mark the items matching the coin. Here we’ve dropped Commodity “Information Technology” on “Vendor” and specified yellow.
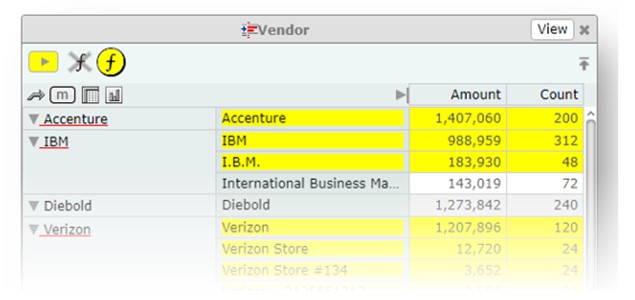
The yellow coin represents just the Vendors we’ve marked – it is independent of the filter that was used to create it. Drag/dropping the yellow coin elsewhere designates those Vendors, unencumbered by any filter.
Now we’ll drop GL “Consulting” on Vendor and specify blue.
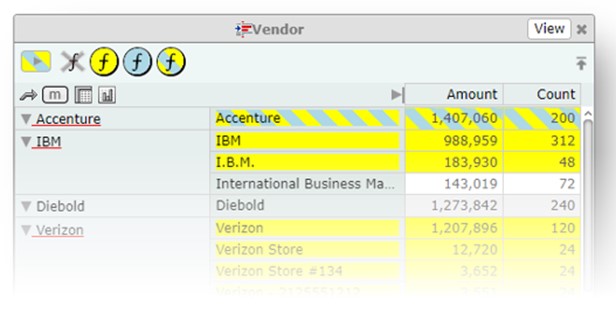
Note that there are now three colored coins available to us – yellow, as above; blue, which designates those Vendors from the “Consulting” GL, and a coin that’s both yellow and blue, representing the intersection of those sets.
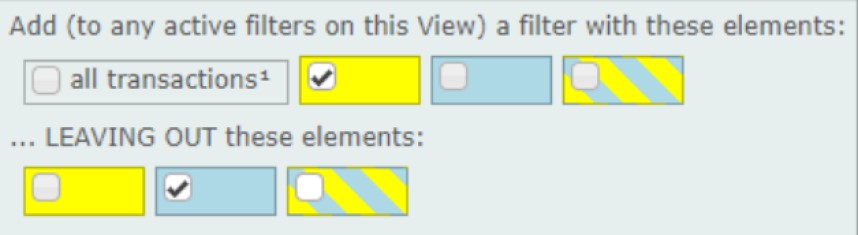
And now novices and advanced users alike can create a complex filter quickly and easily, by simply checking off colors.
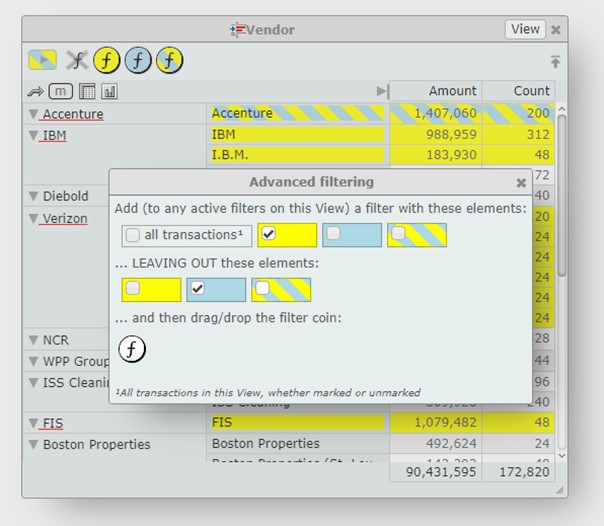
The white coin can be dropped on the viewport to save it, or dropped somewhere else to cause an action.
Of course, you can filter dimensions without limitation. You can even filter across linked datasets – both positively (for like items) and negatively (for differences). You can add, override, or invert filters. Filters can be recalled from history, modified, and re-applied.
Summing up
Spendata has re-thought the spend analysis system from first principles. Much has been learned from our first two (highly successful) products, most of it from watching users struggle with analysis problems that should have been easy. We’re still listening to our users, and Spendata improves every day thanks to their suggestions.