
Spend analysis is the process of identifying potential savings through the detailed examination of procurement data. This requires loading, linking, grouping, and mapping data, then analyzing and modeling the data to produce useful insights.
Spend Analysis as a Managed Service
If a vendor performs these functions on your behalf, as the majority of spend analysis providers do, then the deliverable is a series of canned BI dashboards with data already loaded, linked, mapped, and displayed. This is the modern equivalent of a Powerpoint on the credenza — a series of standardized reports parameterized by the BI tool's ability to filter and pivot.
Aside from the structured reports provided by the spend analysis services provider, any analysis of the data outside that structure must be performed with whatever tools were used prior to the engagement with the provider, typically a spreadsheet.
Spend Analysis as a Product
Spendata delivers a product, not a service. Spendata's tools are designed for quick and effective construction and modification of spend analysis cubes, so that analysts can build and use them efficiently. With our tools, useful results from raw data are minutes away, and refinement of those results can occur over time, as required. Reactive models can be constructed inside Spendata without resorting to spreadsheets or other tools, allowing for dynamic modeling that is responsive to filtering and user input.
Because Spendata is an analysis product, like a spreadsheet, not a collection of static filterable reports as is customary with many spend analysis offerings, basic questions about “can it display this by that?” or “can it do [some other analysis]?” miss the point: of course it can. We provide guidance on quickly building the essential analyses underlying spend analysis and savings, but the sky is the limit on what can be done with Spendata.
A typical Spendata customer builds many analysis cubes, some one-off, some retained over time. Among these are a classic AP spend cube, along with variants of that AP cube that are necessary to satisfy the needs of individual business units. Spendata's unique inheritance capability makes maintenance and refresh of all of these related cubes centralized and easy.
Spendata's services are designed to allow customers to be independent and able to build analysis models on their own. To that end, our "work alongside training" system not only generates useful work from time zero, but also allows for cost-effective use of the training resource — engaging when necessary, disengaging when concepts are mastered.
Spend Cubes, Schemas, and Truths
There are fundamental mischaracterizations about spend analysis that are commonly repeated by both vendors and pundits, and these (very old) ideas seriously impede savings velocity.
- "One cube for all" seems attractive, but it is a quixotic mission. Nevertheless, it is the typical deliverable of a spend analysis services vendor. In practice, multiple commodity-specific, vendor-specific, and function-specific cubes are required in order to identify item level savings. Individual departments or business units have needs that vary, and cubes that are useful for them will differ substantially.
- There is no such thing as a "single source of truth." This has been a selling point for spend analysis over the years, but in reality there are many truths, and what is true for one group of data sources and consumers is not true for others. The only truth is that truth depends on the data source and the audience.
- There is no "fixed data schema." That is conventional database thinking, and it is not helpful, because analysts need to add, augment, or change data dimensions in order to produce useful results. Commodity mapping (the "what" of "who buys what from whom") must be modifiable as well, because it will always be an inaccurate view for many data consumers. There is no "correct" segmentation of anything, thus no way of defining a useful schema a priori. The schema must fit the analysis, not vice-versa.
When the spend cube doesn't match the problem space — a virtual guarantee when there's only one, and its format is static — its value evaporates after its limited results are exhausted. Analysts quickly revert to doing whatever they were doing prior to the availability of the spend cube.
Essential Tools
The tools used by a spend analysis services vendor aren't provided to customers. The presumption is that the end user has no interest in analyzing data beyond the dashboards provided.
Spendata's presumption is exactly the opposite: that customers will want to analyze data and extract value from spend (and other) data on a continual basis. This data includes not only AP data from multiple systems, but also contract information, preferred vendor lists, distributor feeds, and item level detail from distributors and individual suppliers.To do this, analysts need powerful, easy-to-use tools. Business users are conversant with data, but they are generally neither programmers nor database experts. Spendata makes it possible for users to build analysis cubes quickly and easily without any specialized knowledge.
Our toolset is based on 20+ years of experience building, using, and supporting spend analysis software. We address both simple and complex analysis challenges, and our tools (which are under constant development) remain robust as your analyses gain sophistication over time.
Analysis Challenges: Examples
It is difficult to convey in a single document the many innovative features Spendata has developed to empower its users, but a few examples can be illustrative.
Loading data
The simplest of the data analysis challenges seems, at first glance, to be the loading of the data. Spreadsheets and BI tools can load column-oriented transaction data quickly and easily, and filter around it competently.
But that ease is illusory. Consider these common situations (one or more of which you will surely encounter):
- What if there are feeds from multiple sources, in multiple formats, with columns named differently and organized differently?
- What if the feed from the original source changes format (owing to a new extraction script, the old one having been misplaced)?
- What if the original feed neglected one or more useful fields that will be required for future analyses?
- What if useful new fields from the original source or from a new source are added months or years after the original feeds?
These problems are typically addressed with external tools, such as "ETL" tools or hand-wrangling of formats by IT resources. Accommodating new fields is difficult and expensive to accomplish, requiring schema changes and database expertise. Translations from one format to another are equally problematic, since these can require programming skills or mastering of a complex ETL tool.
Addressing these issues is often beyond the scope of what is reasonable to expect from a business data analyst.
Spendata's Intelligent Loader makes merging of disparate data and augmentation of existing data with new fields quick and easy, and it is all done within Spendata. Data matching can be done by name, or manually, with a simple and intuitive user interface. New fields can be added, with previously-loaded data extended automatically with default values in those fields.
When more elaborate transforms are needed, Spendata can accomplish those as well. Because dimension derivation can be multi-pass and dependent on other dimensions, Spendata's data transformations can utilize not just the raw data fields of one transaction, but mapped and other derived dimensions from multiple federated datasets, user-modifiable parameters, and, when appropriate, javascript fragments or functions for decision-making. The context for a transformation can span transactions (necessary, for example, when dealing with milepost data). Spendata is a more powerful ETL tool than an ETL tool itself because an ETL tool's context is limited to raw data and it has no access to processed data.
For more perspective on this, see
Deriving dimensions
Building filterable dimensions may also seem at first glance to be simple and easy. BI tools, for example, can do so quickly.
But that simplicity is illusory. Consider these common situations:
- Your analysis requires a new dimension that has nothing to do with the raw data, for example "Preferred Vendor." You need to create the filter points necessary — "Preferred", "Approved", "Discontinued", and so on — and you need to map your suppliers to those filter points.
- You need a dimension that is dependent on a derived dimension. For example, suppose you need a dimension that is true for certain Vendors in certain Commodities only. You can't derive this dimension until Commodity is derived, and mapped; but Commodity doesn't exist yet, nor have any mapping rules been applied. In order for this to work, you would have to derive and map Commodity before deriving the new dimension. In Excel, this sort of thing is managed automatically, because Excel maintains dependencies for you. Databases and BI tools do not.
- Example: Make a filter for commodities that have more than 1 vendor that represents 80% of the spending in that commodity. Update the analysis for a specified time period.
- Example: Segment the tail spending into vendors which have only 1 transaction in the last 24 months and those that have activity in 10 of the last 12 months.
- Your analysis needs a measure that brackets a value (>x, >y, and so on) that is summed over matching items in a federated or linked dataset. This requires a dependency that crosses dimensions, requires the link to be built, and requires a rollup of the linked dimension. Excel can do this (with great difficulty), but BI tools and databases cannot.
- Example: For different types of facilities services, find outliers for the 3 month average $/sq. ft. and 3 month average $/FTE where the spending is a function of the Commodity mapping, the square footage is derived from a table of property locations, and the FTE count is taken from a table of employees that links to cost center.
- Your data consists of repair records that are generated over time, and you need a dimension that is the time difference between the records. Your dimension spans transaction rows; it needs context that doesn't exist at the raw data level.
Spendata handles all of these situations, and more, because it maintains inter-dimension dependencies analogous to the dependencies maintained by Excel. It goes even further, allowing dependencies on individual cells in data views, user inputs, or script-generated data. When complex decisions are required, Spendata's derivation process is easily extended with user-generated javascript, whose inputs are other dimensions, value cells, user inputs, and so on, across datasets.
This means that a single mapping operation, or a user input, can cause a ripple effect of derivations, mappings, and so on propagating through the entire workspace, just like a spreadsheet.
For more, see:
- A Database That Responds Like a Spreadsheet
- Databases Should Perform Like Spreadsheets
- Closing the Analysis Gap
Mapping
Most vendors focus on commodity mapping, since that is the first and most common use of mapping in spend analysis. However, it is only the beginning of the mapping (aka segmentation) that is necessary to understand, manage, and reduce spending usefully.
Spendata's mapping tools allow mapping of any dimension, not just Commodity, with tools of unequalled flexibility. Mapping can occur at any time, and mapping changes are applied and reflected in real time. Mapping is not an offline process in Spendata — it is part of the tool set and something that users do all the time, not just once every refresh period.
Spendata's commodity mapping uses first-generation AI (heuristics and knowledge bases) to family Vendors and map them to commodities. Those knowledge bases can be extended by users with Spendata tools as required. Mappings from this process are "good" mappings: they can be trusted to be directionally correct. Users can then (optionally) apply Spendata's genAI mapping facility, which uses generative AI (the best public model we can find) to map the remaining vendors.
GenAI mappings are identified to users and can then be vetted with Spendata tools specifically designed for this purpose. This vetting is necessary because of genAI's propensity to invent answers and truths. Trusting AI to produce accurate mappings is unwise, since the fallout from an inaccurate mapping can jeopardize an entire initiative: imagine the situation where an egregious mapping error is identified by a stakeholder not fully supportive or skeptical of the mission.
For more on mapping, see:
The Refresh Process
Spendata enables a data team to perform initial data loading, derive dimensions, generate data mappings, link data, model, and perform complex analysis through easy-to-use interfaces. When the next month of data arrives, all these transformations are applied automatically by Spendata. Spendata tracks all the transformations with rules and keeps track of all the dependencies. When new data is added, all these rules are applied in sequence, so the entire logic path is automatically applied without any intervention. Complex calculations and models are also automatically updated for instant access.
Spendata tracks where each field in each transaction came from and how each transformation was applied. This means that a user can know exactly why spending is treated a certain way. This is not easily done in a spend analysis system that uses separate processes for ETL, data transformation, and data analysis, and then displays its results using a standard BI tool.
Linking data
Databases have been linking data tables together since the advent of relational databases fifty years ago. Linking seems easy: identify a common key in the raw data, and link on the key. Any database or BI tool (and even Excel, with VLOOKUP) can do this.
But it turns out that linking "database style" on raw data keys is a poor idea unless the data is perfect. In messy business data, it is uncommon for raw data keys to link usefully. This is why Spendata links on derived dimensions, never on raw data. Of course, in order for that to work, dependencies have to be maintained between the link and the derivations of the dimensions in the linked datasets. Spendata maintains those, too.
Here's an example of why this is important. In the following example, if we link by Vendor (raw data), then we end up with a poor linkage of little value:
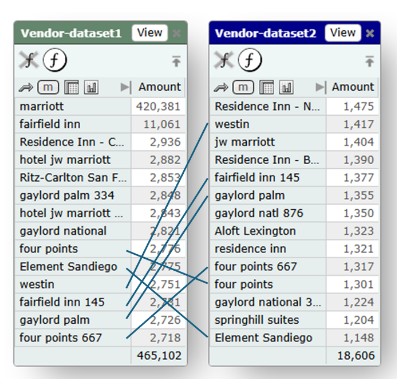
On the other hand, if we link on the Vendor Parent from both sides, which is a derived and mapped (familied) dimension, we get a much more useful match:
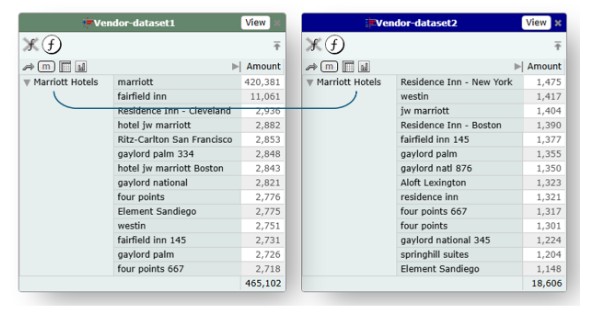
Here's how linking on derived dimensions allows for easy linking of contract data with spend data:
Modeling
In a BI or database system, models are difficult to build. Custom programming is required, and dependency maintenance is nearly impossible.
In Spendata, however, where dependencies are automatically maintained by the system, reactive models can be built quickly and easily. By changing one mapping, for example, the entire analysis can be altered in real time. Since dependencies can be created on individual value cells in data displays — just as in a spreadsheet — the very act of filtering a dimension can change everything in the dependency path.
Models at database scale cannot be built in spreadsheets, but they can in Spendata.
When data is refreshed, all of the transformations, choreographed by the dependency system, are applied in sequence, so the new data is automatically derived, mapped, and so on. Any Spendata cube can be rebuilt from scratch — for example, remove all the data from the cube, add it back, and you will end up with exactly the same cube.
For more, see:
- Dynamic Mapping and Derivation: The Next Step in Spend Analysis
- The Joy of Mapping: Modeling at Database Scale
Inheritance: Sharing cubes usefully
It's impossible to satisfy every consumer of spend data with a single, centrally-mapped, read-only spend cube. The reasons are many, but the most important one is this:
Different stakeholders have different analysis needs.
- The IT group might want to understand its total spend with a particular vendor. But a centralized spend cube cannot provide this information, because some purchases are made through distributors and others directly with the vendor. More data needs to be incorporated into the analysis, in this case invoice detail from the distributors.
- Facilities has contracted with a services vendor for janitorial work, security, and outdoor maintenance. But there is uncertainty as to whether the rates actually being charged are the negotiated rates. Invoice data and contracted rates from the vendor must be included in order to perform the analysis. This information isn't available from a centrally-maintained cube of accounting system data.
- A data analyst is charged with producing custom analyses for management. She is routinely asked for reports that segment the data differently than the dimensions chosen by the cube maintainers. She needs to take different cuts at geographies, to combine some mappings together and separate others. She is asked to build models that simulate the result of cost-cutting strategies. None of these things are possible using a centrally-managed spend cube. She cannot change or modify the centralized cube, so it is useless to her.
In order to accomplish any of the above analyses, there has historically been only one course of action: download transactions, add new data to them, and analyze them elsewhere — typically in Excel. That was an inadequate answer when spend analysis systems appeared over 20 years ago, and it's just as inadequate now.
The Problem With A Centralized Cube
Every analyst and department wants access to the latest transactional data posted to the accounting system. They will also want access to whatever enhancements are performed centrally that could save them work, such as familying Vendors and mapping AP spending to Commodity.
That is the idea behind a maintained and continually refreshed centralized cube.
The problem is, a centralized cube just isn't that useful on its own. Users will need to overlay on top of it their own perspectives on mapping, add new data to it, and create custom data dimensions, views, and reports. Those operations can't be done with a read-only spend cube, and they are very hard to do with ordinary databases and spreadsheets. That's why most productive analyses of spend data — which require all of the above additions to (and customizations of) the central cube — are so very difficult to perform. Since a centralized cube offers no ability to modify it — many spend analysis vendors publish to off-the-shelf read-only BI tools like Qlik or Tableau — the spend cube devolves into merely a source of slightly better data with no further intrinsic value or use.
A New Perspective: Centralized AND Customized
Analysts as well as business users need to be able to make changes to the cube to support whatever line of reasoning they may be following. One group may think of a vendor as a logistics company; another might consider them to be a fuel supplier. Both points of view are likely valid. Indeed, studies have shown that it is difficult for experienced commodity managers to agree on vendor classification, even under the best of circumstances with clear heads and no pressure.
And, different groups of users will have deeply different interests. The IT group has zero interest in Marketing vendors, and vice-versa; so why subject them to each other's noise? The resulting cube will be top-heavy and useless — and it won't satisfy either group in the end.
So why not let stakeholders modify the base cube as they see fit, and also allow them to accept base cube changes when they become available? That way they keep their hard-won custom analyses over time, while benefiting from the refreshed data in the base cube. That's what Spendata's unique inheritance capability makes possible. No more arguments about what should be mapped where, or what dimensions should be built, or what data should be added; instead each stakeholder can do whatever is best for their own purposes.
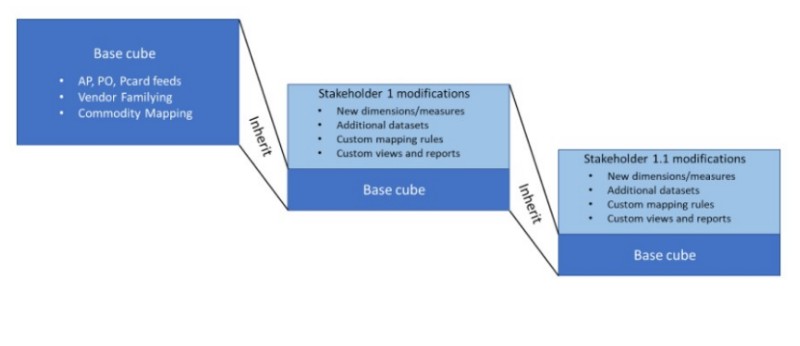
In the diagram below, we have a base cube that is being refreshed from AP, PO, and purchasing card feeds on a regular basis. A stakeholder group modifies the base cube with custom dimensions, datasets, mapping rules, and so on. On refresh, the base cube changes are automatically merged with the stakeholder's custom modifications. Spendata ensures that the base cube modifications do not undo any custom changes.
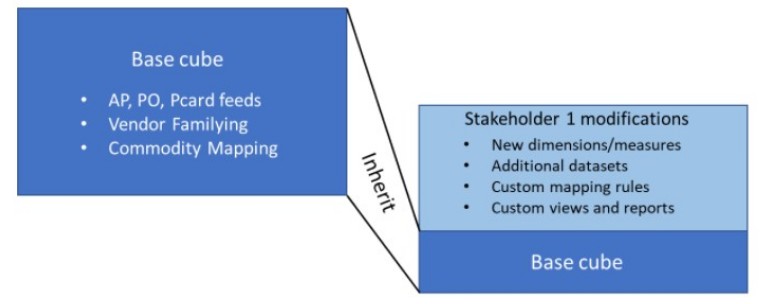
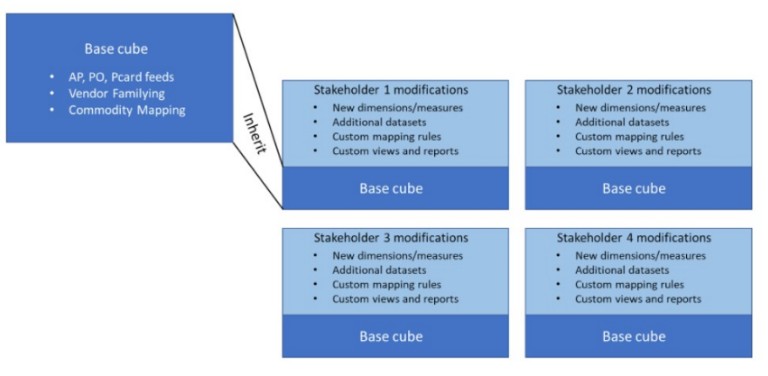
Obviously many stakeholder groups, including individual analysts, will set themselves up similarly
Because stakeholders can now modify and extend the cube to suit their needs, there is a shift in thinking from "How can I get data out of the cube so I can analyze it?" to "How can I use the cube to analyze my data?" The latter approach is dramatically better: answers and analyses come quickly, they're auditable, and they're repeatable and maintainable over time.
Of course, there is no reason why there should be only one level of inheritance — in fact, it is easy to see that there should be multiple levels. For example, individual IT analysts may have divergent needs for different purposes, so why shouldn't their starting point be the IT cube? In the diagram below, the cube marked "Stakeholder 1 modifications" becomes the "base cube" for the cube marked "Stakeholder 1.1 modifications" — and so on. Each inherits from its parent.
Summing Up
Who among us possesses the hubris to imagine that s/he could organize and map an analysis cube suitable for every consumer? It's flatly impossible, of course.
And what do we mean by "analysis"? Drilling around prefabricated dimensions of a fixed schema in a read-only BI tool? That's not analysis, and it's why real analysts are forced to download spend data to Excel or other third-party products to get real value from it.
But if a stakeholder cube can be built by modifying the base cube — benefitting from all the upstream refreshes and classification changes that have been made, with analyses being constructed and models being built right in the cube and preserved across refreshes — then that's a game-changer.
For more discussion of inheritance, see:
Advanced feature example: Recursive Segmentation
Spendata provides many functions not normally available in any analysis system. One of these is "recursive segmentation", otherwise known as View-based measures.
Sometimes a rolled-up measure is useful not only as a measure, but also as a filterable dimension. Normally this requires the extraction of the measure, then the loading of that measure back into the cube, then linking it with the rest of the data. That process is not only tedious, but it's also invalidated by the next data refresh, requiring it to be repeated.
Spendata makes this easy to do, and maintains the new dimension automatically across refreshes. See:
- A New Way to Slice and Dice: In Practice (for a case study)
- A New Way to Slice and Dice (for an overview)
Automation Via API
Unlike BI tools, which severely limit API access to functionality, all of the features and functions in Spendata can be driven remotely via API. This is a restful API which only accepts connections from the local machine (for security).
What this means in practice is that monthly refreshes can be almost fully automated, with just a minor amount of manual overview to ensure that new vendors are mapped correctly.
It also means that connections to Spendata can be made from other analysis engines, such as R. Python scripts can trivially extract data from Spendata, further enabling analysis via statistical and other libraries available with Python. Scripting languages can orchestrate Spendata together with other related processes easily.
Last but not least: Security
Spendata runs entirely locally. With the exception of genAI mapping, Spendata never moves data from the user's machine. There is no server involvement in Spendata operation, so there is no need to move the data anywhere.
This means that user data stays behind the user firewall, on the user's machine. Spendata does not store user data on a server; its server exists only to download the Spendata application to a browser running on the user's machine.
Since Spendata has no access to user data, it cannot provide that data to any third party, whether that request is from a government or from a lawsuit. We simply do not store user data on any machine controlled by us; end of story.
This means that Spendata solves many issues of data security out of the box.
For more on this, see: